Portfolio Analytics Platform
A custom data platform and portfolio intelligence tool built for a boutique asset management firm — systematic factor scoring, asset allocation, and qualitative LLM governance on a self-hosted, cost-efficient stack.
Overview
Quantitative models are rigorous but blind. They score a company on earnings yield and return on equity, but they cannot read a CEO letter and sense that the thesis has quietly changed. Qualitative research is perceptive but unscalable — a skilled analyst can hold deep conviction on a handful of names, but that judgment evaporates when applied across a portfolio of fifty.
A boutique asset management firm came to JPR Labs with this exact tension. Their investment process was sound in principle: a systematic, factor-driven approach to equity selection. But in practice it was fragile — data lived in disconnected silos, factor calculations were repeated manually each month, and qualitative insights existed only as notes in a spreadsheet with no way to tie them back to actual position sizing.
JPR Labs designed and delivered a full-stack portfolio intelligence platform from scratch: a data platform that ingests and models live market data through a medallion lakehouse, a quantitative factor engine that produces explainable, sector-relative scores across every holding, and a first-of-its-kind LLM qualitative governance layer that lets AI-driven research influence — but never corrupt — the systematic process. Everything runs on self-hosted infrastructure at a fraction of the cost of comparable institutional tools.
The Challenge
The firm had three interlocking problems:
- No unified data layer. Market data, fundamentals, SEC filings, and sentiment feeds came from different sources and required manual reconciliation before any analysis could begin.
- No systematic, auditable scoring. Stock selection mixed rules and intuition without a repeatable process. Good decisions were hard to replicate; bad ones were hard to learn from.
- Qualitative research lived in a dead zone. The team had real expertise in reading companies — management quality, competitive moat, accounting red flags — but there was no structured way to let that judgment interact with the quantitative model. It either overrode the numbers entirely (emotional) or was ignored (wasteful).
Engineering Solution
Data Platform: Medallion Lakehouse on Self-Hosted Infrastructure
We designed a three-tier Bronze / Silver / Gold medallion architecture using DuckDB as the analytical engine on local NVMe storage — the same cost-efficiency philosophy behind our QuantLens data platform.
| Layer | Purpose | Examples |
|---|---|---|
| Bronze | Raw ingestion from APIs — prices, fundamentals, filings, sentiment | Market price history, SEC EDGAR filings, FX rates |
| Silver | Cleaned, enriched, properly lagged data | Earnings-lag-adjusted fundamentals, corporate actions, technical metrics |
| Gold | Pre-computed, denormalized outputs ready for serving | Factor scores, instrument master, live quotes |
Why DuckDB over Spark? For a focused, high-performance analytical workload on a single node, DuckDB's vectorized in-memory execution vastly outperforms Spark's overhead. We run full in-memory analytical scans across multi-year market datasets in seconds — on commodity hardware, with zero cluster management cost.
Orchestration: Dagster Asset-Based Pipelines
Why Dagster? We chose Dagster for its asset-oriented model. Unlike job-centric schedulers (Airflow, Prefect), Dagster treats each dataset as a first-class asset with lineage, freshness, and dependency tracking built in.
- TTL-gated runs: Data is only re-fetched when stale. Daily market data doesn't trigger a re-ingest if it already ran successfully that day — eliminating wasted API calls and compute.
- Auditability: Every asset materialization is logged with timestamp, upstream dependencies, and result metadata. The firm can reconstruct the exact data state for any historical decision.
- Incremental evolution: Adding a new data source means adding a new asset definition — existing pipelines are untouched and the dependency graph updates automatically.
Pipelines run on schedule across four layers: Bronze ingestion, Silver transformation, Gold publishing, and a PostgreSQL serving sync for the API.
Quantitative Factor Engine
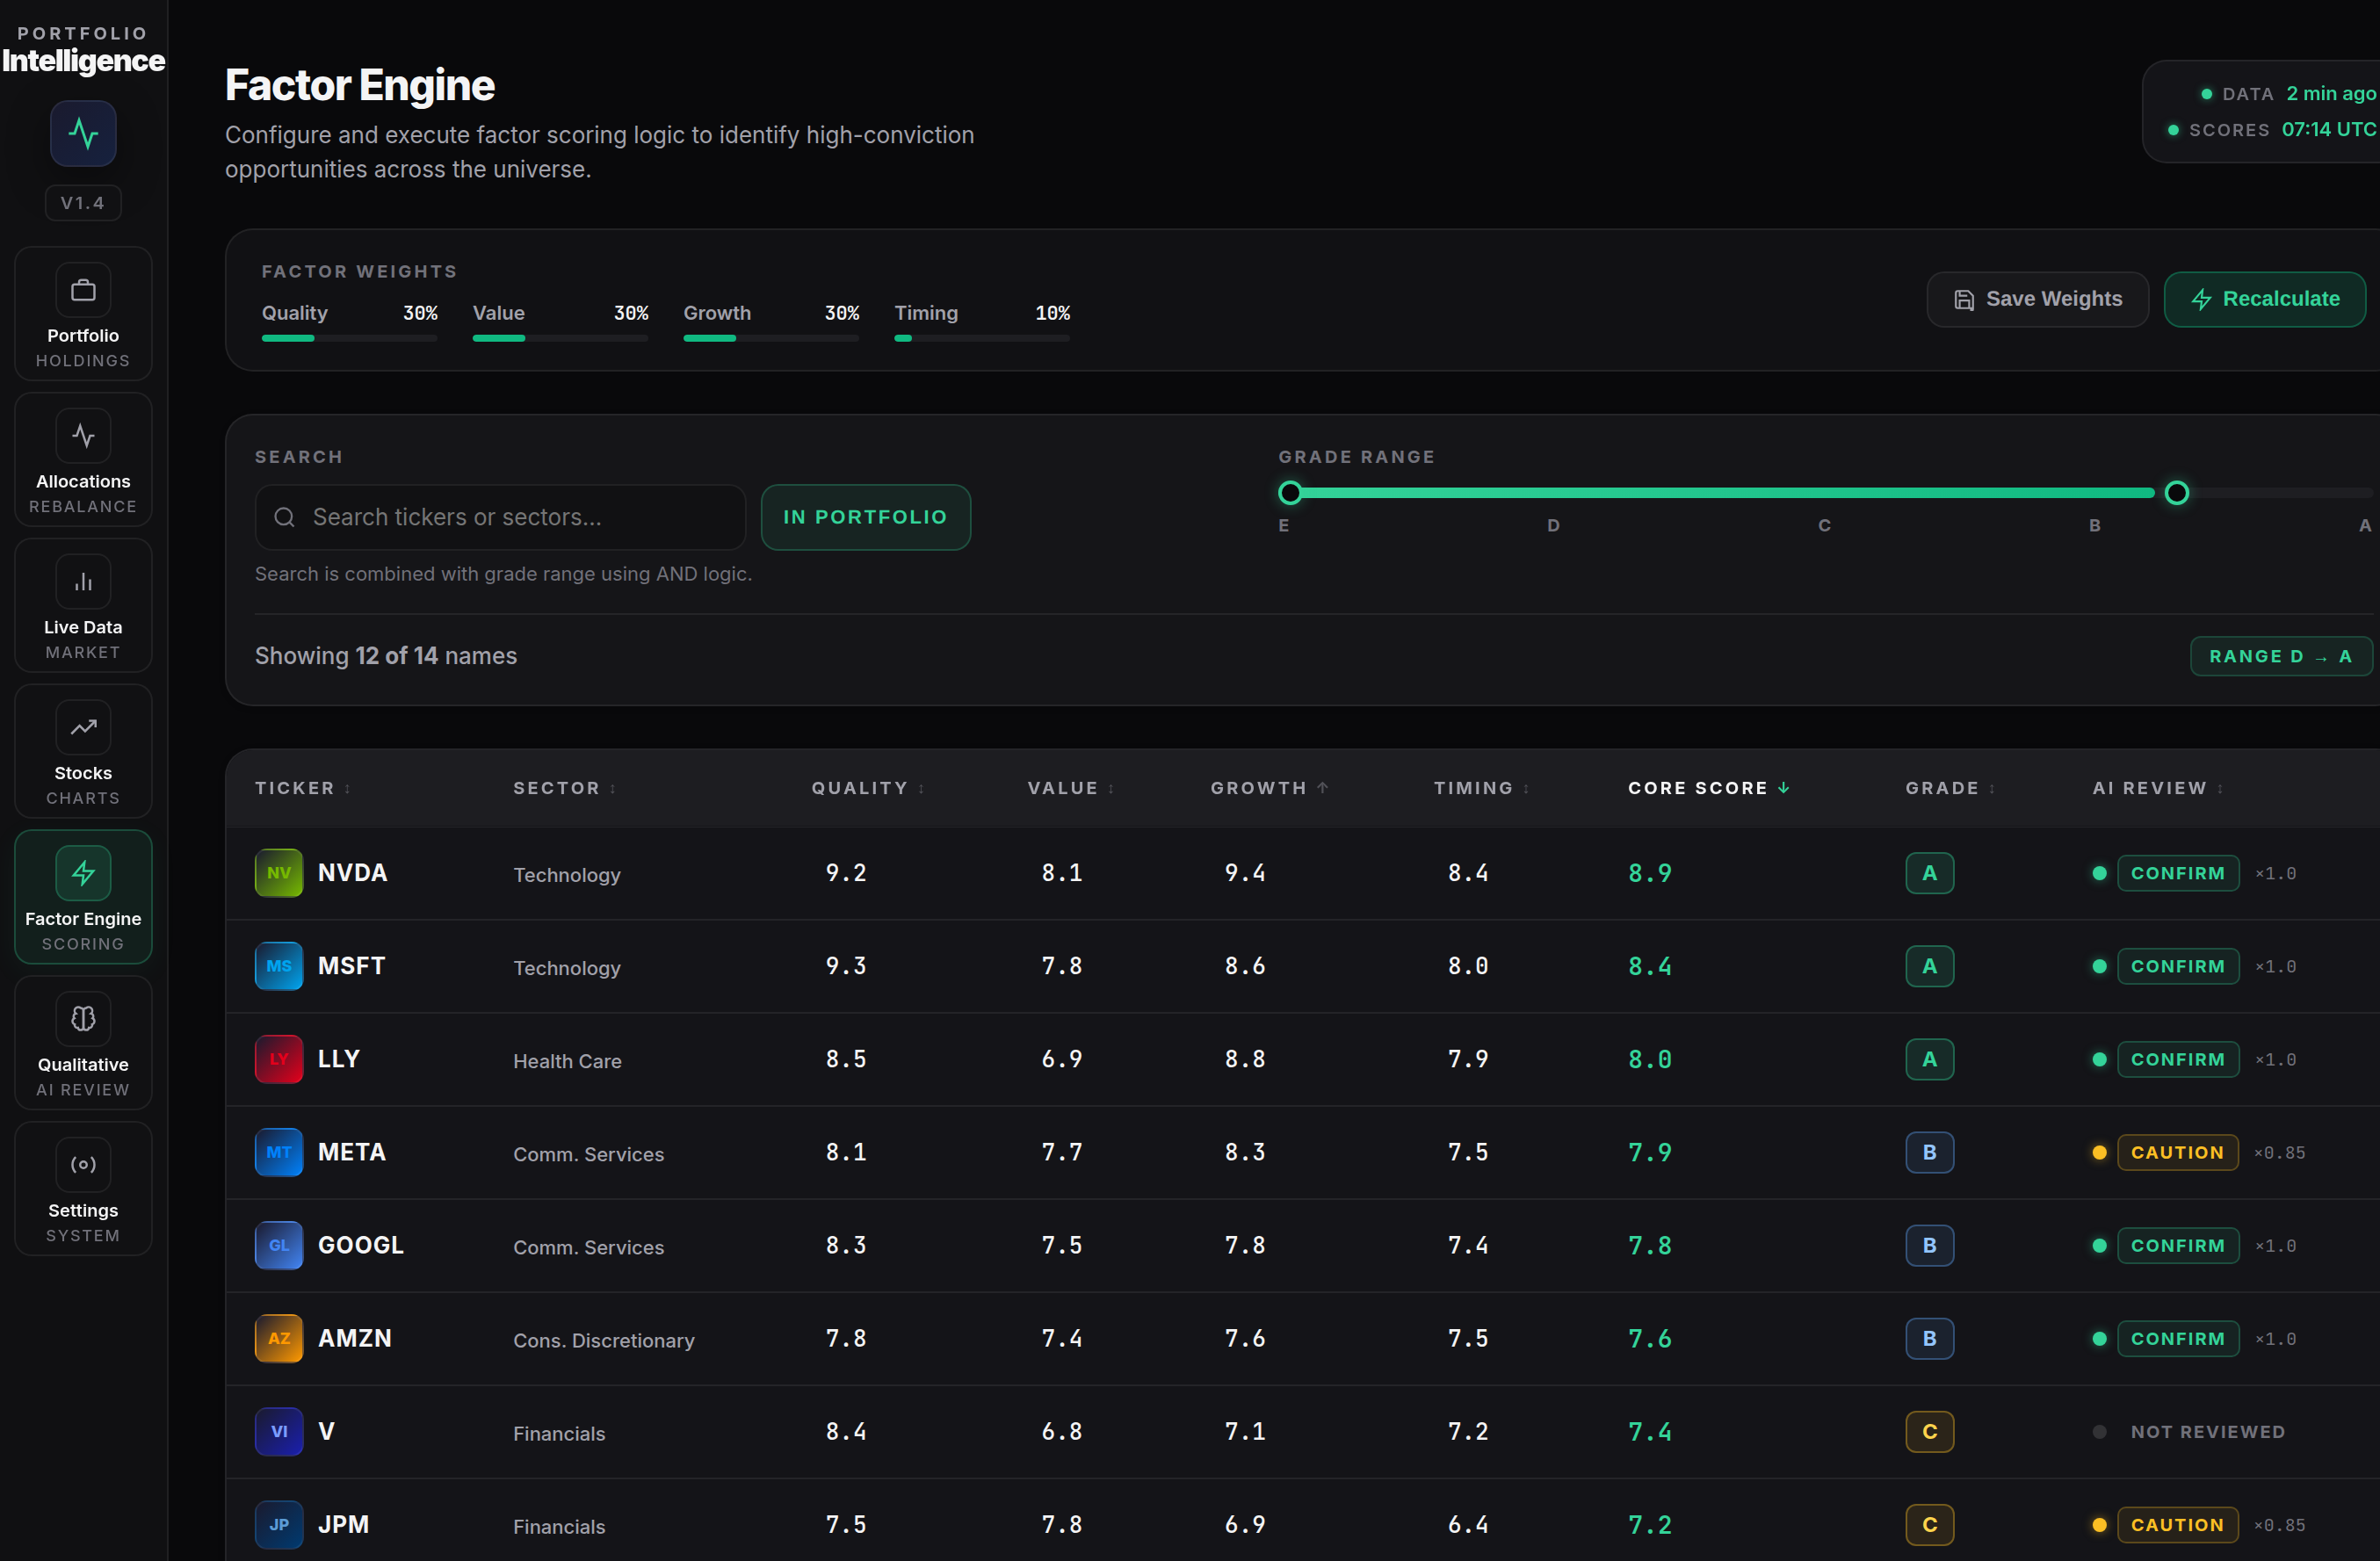
The core of the platform is a stateless, shared factor scoring package — a Python library used identically by both the FastAPI backend (for interactive recalculation) and Dagster batch jobs (for nightly scoring runs), guaranteeing the math is never duplicated or out of sync.
The model evaluates equities across four sleeves:
- Value — earnings yield, EBIT/EV, free cash flow yield
- Quality — ROIC, operating margin, balance sheet discipline
- Growth — revenue growth (TTM YoY), forward EPS growth trajectory
- Timing — trend confirmation, sentiment proxy, pullback quality
The Growth sleeve addresses a structural blind spot in pure value/quality models: a company can look cheap and profitable on trailing metrics while its business is quietly decelerating. By scoring forward earnings trajectory and revenue growth explicitly, the model captures the rate-of-change signal that backward-looking financials miss.
Each metric is scored via a hybrid peer-rank + absolute continuous scoring method:
- Relative: Sector-relative percentile ranking prevents outliers from poisoning the model across market regimes.
- Absolute: A 4-anchor continuous curve (not a step function) preserves information and avoids cliff-edge grade changes.
The final composite score (0–10) maps to allocation units, which feed a risk-scalar-adjusted position sizing model with hard concentration constraints (single-name caps, sector caps, minimum position floors).
Every score is fully explainable — the system captures peer counts, z-scores, percentile ranks, imputation flags, and grade threshold logic for every row, every run. No black boxes.
Bridging Quant and Qual: The LLM Governance Layer
This is the architectural centrepiece of the platform — and the hardest problem to get right.
The standard approaches both fail. Letting qualitative judgment override the model freely makes the systematic process meaningless: one strong conviction and the discipline collapses. Ignoring qualitative insights entirely wastes real expertise and leaves the model exposed to risks that numbers cannot capture — a CEO who has quietly changed direction, a competitive moat that is eroding faster than margins yet reflect, or forensic red flags buried in footnotes.
We designed a third way: an LLM evidence layer that can only govern downside, never inflate upside.
How It Works
The system automatically ingests SEC annual and quarterly filings for every holding and passes them through a structured prompt library covering three domains:
| Analysis Type | What the LLM Evaluates |
|---|---|
| Management Quality | Capital allocation track record, insider alignment, consistency between stated strategy and actual decisions |
| Moat Durability | Competitive positioning, pricing power, switching costs, emerging competitive threats not yet visible in financials |
| Forensic Red Flags | Accounting anomalies, aggressive revenue recognition, deteriorating cash conversion, off-balance-sheet risks |
Each review produces a structured verdict with one of three decision labels:
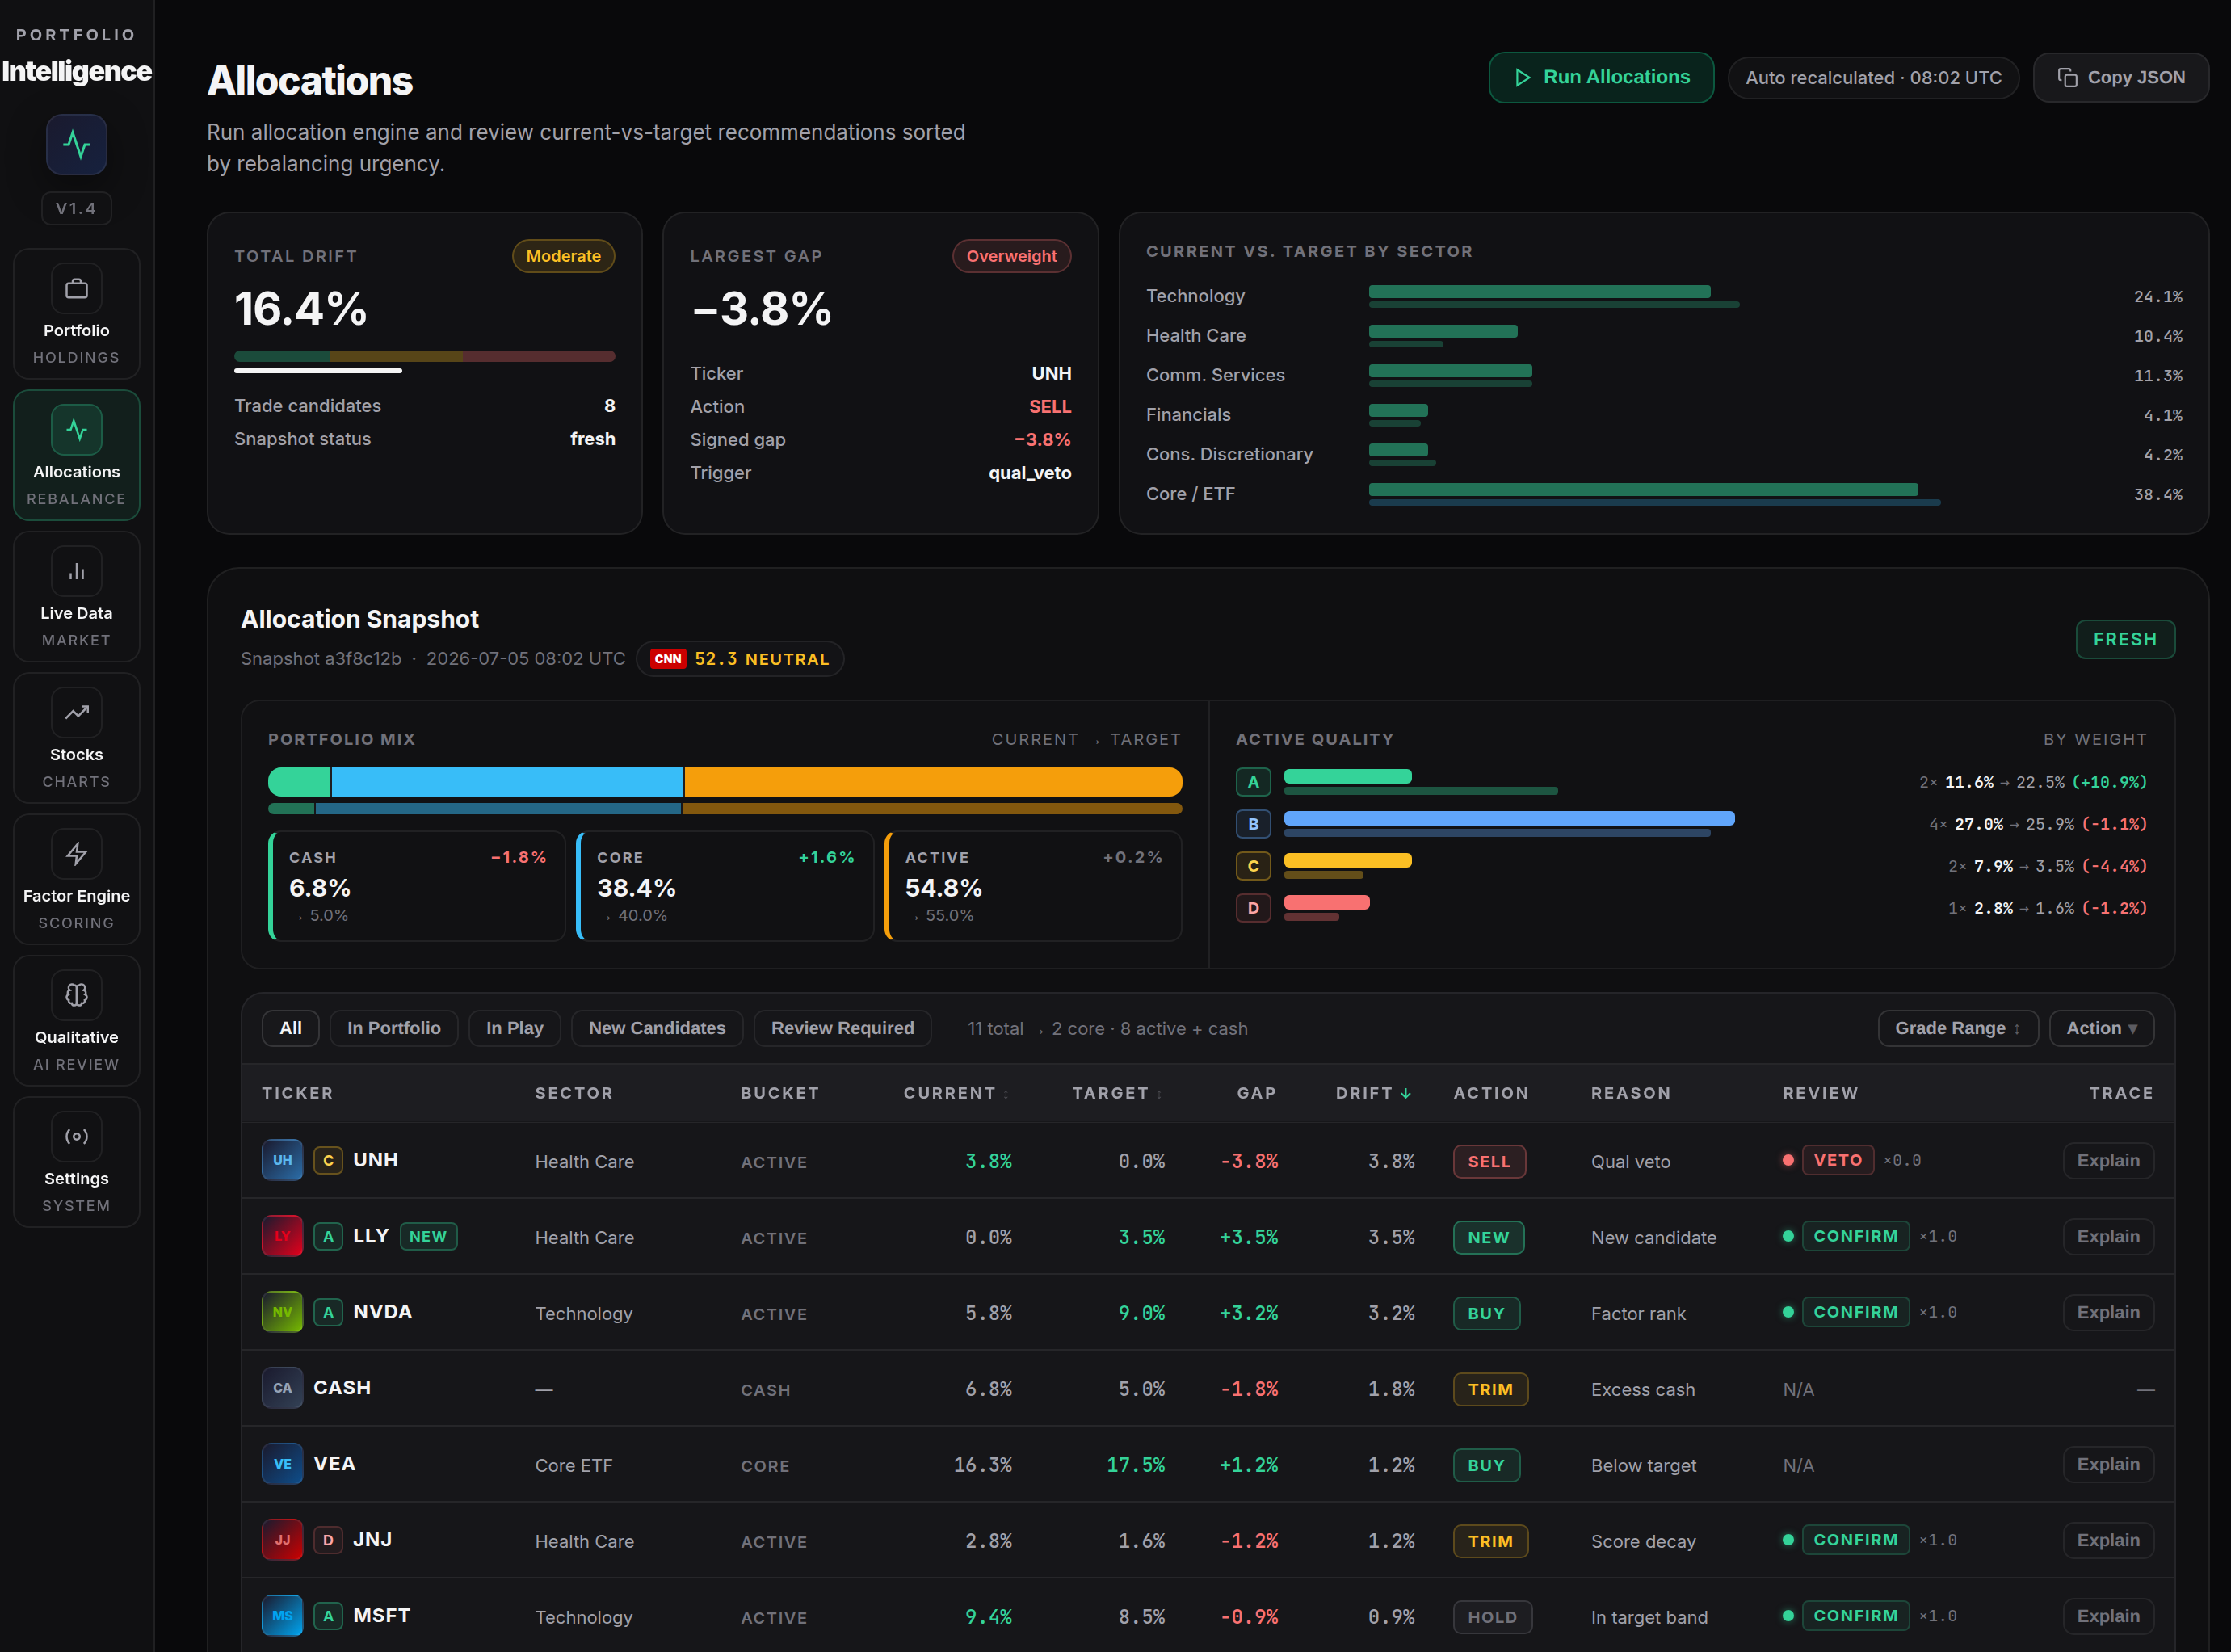
- Confirm — the qualitative thesis supports the factor score; position sizing proceeds as calculated (multiplier: 1.0)
- Caution — real concerns exist but don't warrant a full block; the system trims the target allocation (multiplier: 0.85)
- Veto — a material thesis-level concern; no new capital is deployed until the position is reviewed by the team (multiplier: 0.0)
The key architectural constraint: LLM verdicts can only reduce a target weight, never increase it. The quantitative model sets the ceiling; qualitative judgment governs the floor. This means the factor discipline is structurally preserved — an enthusiastic LLM review of a low-scoring name cannot manufacture a position.
Auditability by Design
Every LLM review is:
- Versioned and dated — tied to the specific filing it analysed
- Citation-linked — the reasoning references exact passages, not general impressions
- Expiry-gated — reviews older than 60 days are flagged as stale and trigger a re-run request; the system cannot act on outdated qualitative data silently
This creates a full audit trail: for any position, at any point in time, the team can reconstruct exactly what the factor model said, what the LLM review found, and how the two combined to produce the final allocation.
Why This Matters Beyond Finance
The pattern — systematic quantitative model + governed qualitative layer that can only constrain, never override — is directly applicable to any domain where structured data tells part of the story and expert judgment tells the rest: industrial equipment health scoring, supplier risk assessment, credit underwriting, or predictive maintenance triage.
Serving Layer: FastAPI + React Dashboard
A FastAPI backend exposes factor scores, portfolio allocation targets, and qualitative reviews via a typed REST API. A React PWA provides the operational interface: a Bloomberg-terminal-style dashboard for monthly portfolio review, rebalancing action queues, and factor deep-dives with full explainability drill-down.
The monthly workflow is a clean sequence: refresh scores → review qualitative flags → see action queue → execute trades → log decisions with rationale. What previously took a full day of manual work now takes under an hour.
Why It's Cost-Efficient
| Component | Our Approach | Institutional Alternative |
|---|---|---|
| Data orchestration | Dagster OSS (self-hosted) | Databricks Workflows / Airflow managed |
| Analytics engine | DuckDB in-memory | Apache Spark cluster / Snowflake |
| Market & fundamental data | yfinance, SEC EDGAR, ECB FX APIs | Bloomberg Terminal (€25k+/yr), Refinitiv Eikon |
| Infrastructure | Self-hosted VPS (Hetzner / Scaleway) | AWS / Azure managed data warehouse |
| Qualitative research | Claude API + Gemini API (pay-per-use) | Proprietary research platforms, sell-side subscriptions |
The result: institutional-quality systematic analysis — including AI-powered qualitative research — at a fraction of the cost, with full data sovereignty and zero vendor lock-in.
Business Outcomes Enabled
- Systematic, auditable stock selection — every score is traceable to its inputs; no black-box judgment calls
- Qualitative research with structural discipline — LLM insights are formally integrated into position sizing without ever being able to corrupt the quantitative model
- Automated monthly workflow — what previously took a full day of manual work now runs on schedule, ready when the team sits down
- Risk-aware position sizing — concentration governance enforced programmatically, including qualitative veto flags
- Living audit trail — every decision — quantitative score, LLM verdict, final allocation — is versioned, dated, and reproducible
- Full data ownership — no dependency on any vendor for data access, computation, or research; the platform runs independently
Stack at a Glance
Orchestration: Dagster (asset-based pipelines, TTL gating, lineage)
Analytics: DuckDB (vectorized in-memory), Polars (numerical compute)
Storage: Medallion lakehouse (Bronze/Silver/Gold), PostgreSQL (serving)
Backend: FastAPI (async), SQLModel / asyncpg
Frontend: React + TypeScript, TanStack Router, TanStack Query
LLM: Claude API, Gemini API (qualitative governance layer)
Data Sources: SEC EDGAR, market price feeds, FX rates, sentiment indices
Infrastructure: Self-hosted VPS, Docker, IaC
— Pedro
Founder & Principal Engineer